
Every Oracle DBA will have a set of SQL scripts that they will call upon time and time again in a variety of scenarios – to diagnose performance problems, to check configuration, in response to frequent user/management queries and so on.
Each DBA will have their own set of scripts that they may have built up over several years – some will have been found on My Oracle Support, others from general Google searches, some developed by colleagues and some written by themselves. Some DBAs will jealously guard their scripts like a dragon and its gold but most DBA teams will typically share these scripts around themselves or store them in a central repository.
In this blog I will list out some bits of SQL that I use as an Apps DBA when working in an Oracle E-Business Suite environment. Much of this information can be obtained in various screens and Forms within the application, but sometimes it is just quicker and easier to extract this directly from the database without all that tedious mucking about logging into the front end!
I tend to use SQL*Developer to run these as I prefer the formatting and find it easier to use than SQL*Plus.
This is far from an exhaustive list but gives a snippet of the sort of ad hoc queries that are an essential part of my own day-to-day life as a DBA!
1. Concurrent Managers
The following script lists out all running concurrent managers (run as APPS or equivalent).
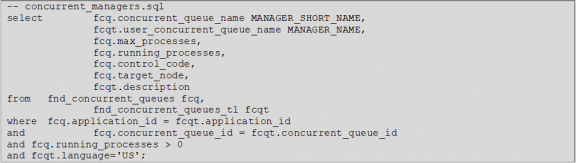
With an output that will look like this:
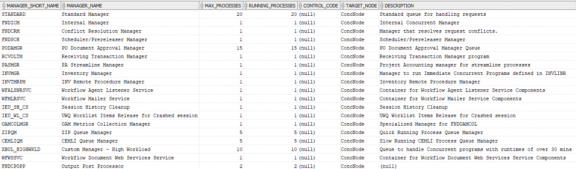
This is useful as a quick way to just sanity check that the concurrent managers are all up and running – that the query returns rows, that running processes matches max processes, and that all expected managers are up.
The query can be easily modified to check for concurrent managers where the max processes does NOT equal running processes, or where running processes is zero.
2. Concurrent Requests
The following script lists out all running concurrent managers (run as APPS or equivalent)
This is one of my go-to scripts and rarely a week goes by when I don’t run some variation on this one.
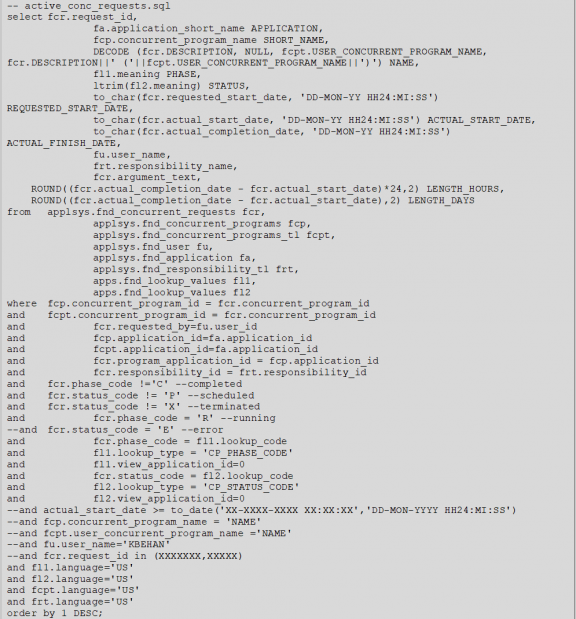
Which generates an output that looks like this:

This is useful to quickly see what might be running on the system when diagnosing a performance problem.
The code can be alerted to easily answer a number of other questions such as:
- Show me all requests that have completed in error
- Show me all pending requests
- Show me all requests run by a particular user
- Show me all requests of a particular name
- Show me all requests submitted on a certain day
- Show me all requests that ran for more than X minutes or hours
- Or any combination of those – for example, show me all requests ran by a particular user last Saturday where the runtime was over 30 minutes, ordered by duration!
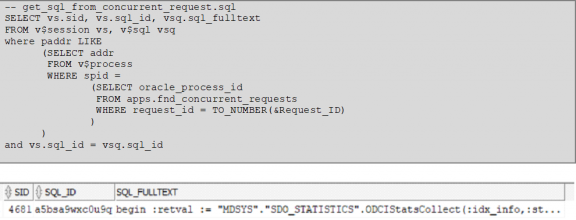
This bit of code will show the SQL that a given concurrent program is actually running and it’s session ID
3. Concurrent Programs
This one lists out some basic information about concurrent programs. It tells you when it was created, the product it is in, the short and long names, the executable and the output.
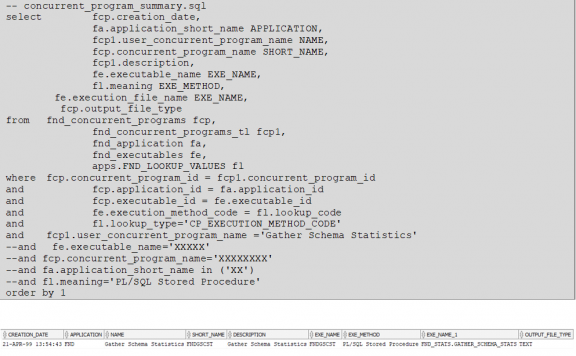
This is something I run typically against custom concurrent programs if I need to delve into the code of something or to see if something has been newly created. I’ve also used it to reverse engineer running code back to the offending request – if I see in a AWR or Statspack report a particular PL/SQL package that looks a bit suspect, I can plug it into this query and find if there is a concurrent program associated with it to understand where that code is coming from.
It can also be modified to list (for example) all concurrent programs in a given product, or those created after a certain date, or all of those with the same executable type.
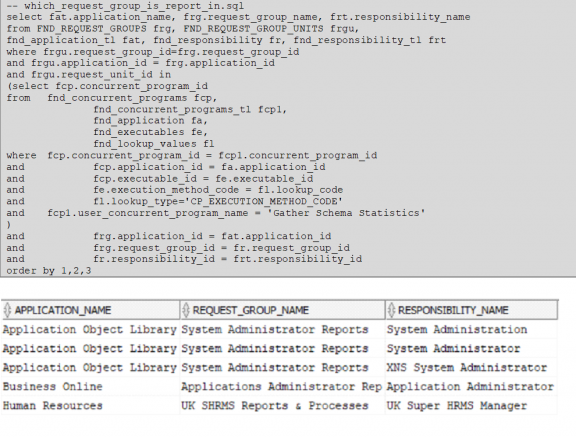
The second script below will list all request groups a particular program is in – answering the question as to who has access to run a certain report.
4. Profile Options
This bit of SQL will display details about profile options including the level it is set at and the profile option ID, name and value.
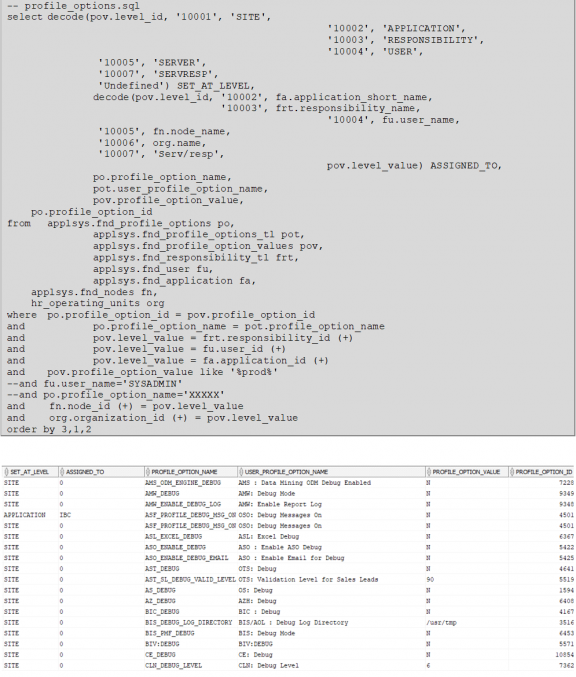
The obvious use for this one is to quickly find what the particular value for a profile option is.
I find it useful when performing clones of environments and then I can easily find any profile option (especially custom ones) where the value may be still pointing to the source database name, server name or port that I may need to manually amend as part of my post-clone process.
It is also useful to see if a profile option has a different setting at User/Application/Responsibility level to that at Site level which may explain odd problems that appear to impact only one or a subset of users.
5. Products
This query lists all eBusiness Suite products, including their installed status, minipack level, database owner and tablespace.
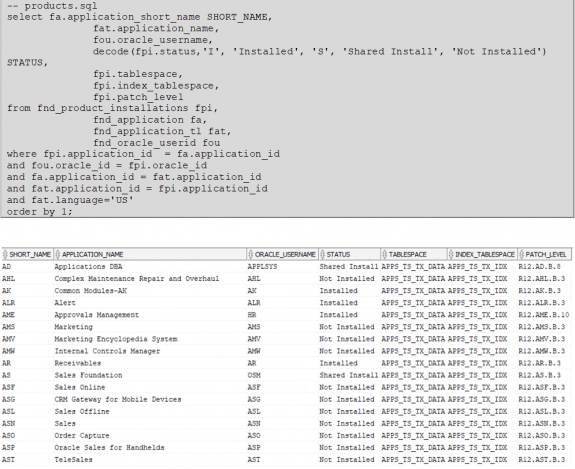
This is useful when a patch says that a minimum code level is required for a product and you want to quickly check this, or to see if a particular bit of functionality is disabled because the application in question is not licensed in the database.
6. Patches
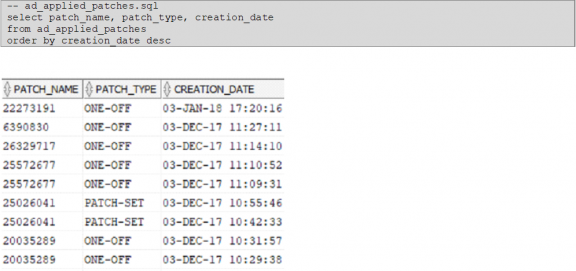
This bit of code lists all patches that have been applied to an environment.
This SQL returns information if a particular bug fix is present in the environment with information on when, how and from where that fix was delivered.
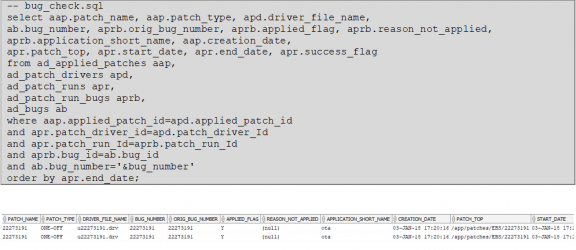
This can be a quick way to check if a bug-fix delivered by patch has already been applied to an environment before bringing the application down and waiting for adpatch/adop to tell you!
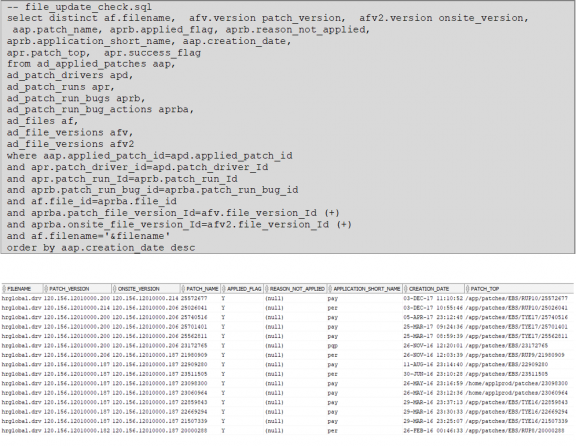
The next script is useful to see what patch may have updated a particular file and to see it’s modification history over time.
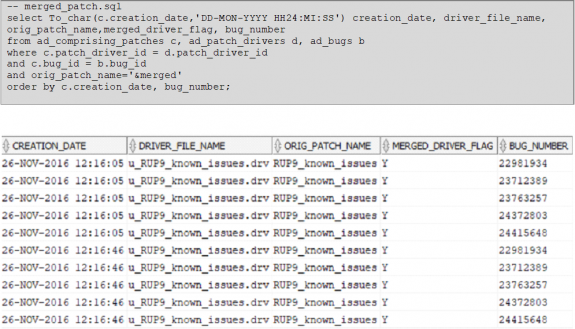
And finally in this section – a script to provide a breakdown of what individual patches were included in a merged patch.
7. Workflow
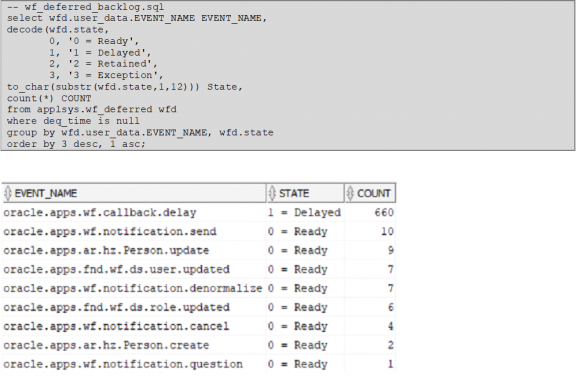
A script that checks the status of the WF Deferred queue which could indicate a problem with the Workflow Agent Listeners or Workflow Background Engine.
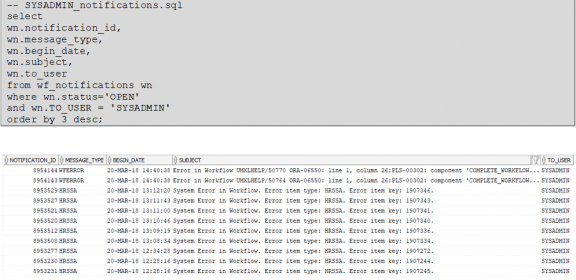
The next bit of code lists all open Workflow notifications that have been sent to SYSADMIN (typically any Workflow that goes into ERROR will send a notification here)
This little code snippet lists what the designated Workflow Administrator role is set to – useful to explain why some users can see Workflow processes for other users when others can’t!

And similarly this bit of code can change it to something else.

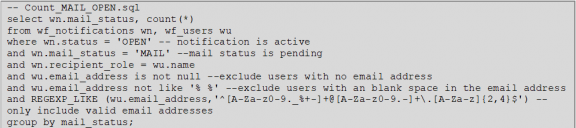
This code will display a count of Workflow emails that are sat as SENT (indicating a possible issue with the Mailer). Rather than a simple count of OPEN/MAIL it also has a number of exclusions to prevent ‘false positives’.
I could go on for much longer but I will stop at this point in the interests of brevity!
I have dozens of SQL scripts stored in my eBusiness Suite folder that I can call upon – some I use for monitoring purposes, others for service reporting needs, others for day-to-day admin or for diagnosing issues.
Choosing the right Managed Services Provider
If you are looking for an Oracle partner who can help you with your Oracle Managed Services and goes about it the right way and can back up the talk, then contact us. If you would like to find out more about the E-Business Suite updates or have a question, you can email us at info@claremont.co.uk or phone us on +44 (0) 1483 549004

Kevin Behan, Managed Services Database Administrator (DBA) at Claremont, with over 20 years of experience in the world of Oracle.